Executive Summary
Nassau County has some of the highest property taxes in the nation. Aside from exemptions, filing a grievance is the primary way a homeowner can lower an assessment, and most Nassau residents know it. Every year, Nassau County publishes a record of which homes got their assessments lowered. Nassau County’s 2025 Assessment Review Commission (ARC) roll tracked 391,629 residential properties. The binary results:
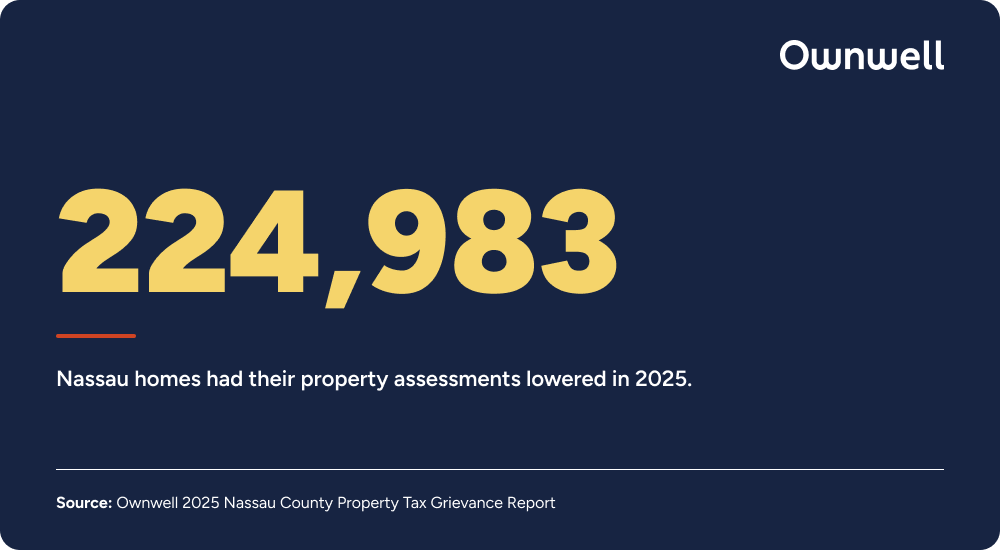
224,983 residential properties (57%) successfully secured an assessment reduction at the ARC level, saving $387.2 million in property taxes.
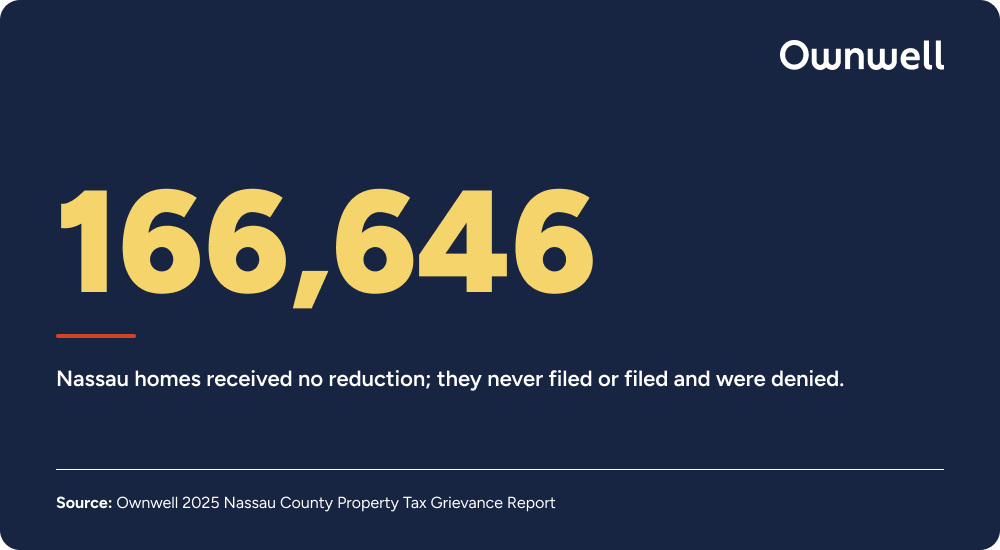
166,646 residential properties (43%) saw no reduction, as they either didn’t file or were denied.
Because these two groups share the same neighborhoods and tax rules, market conditions don't explain the gap. We analyzed these nearly 225,000 successful grievances to reveal how results differed across market value ranges and between cities and towns.
Noteworthy Findings:
Filing is the norm: National appeal rates in large municipalities sit near 2.9%. In Nassau, roughly 63% of residential properties filed a property tax grievance.
Winning is common, but results vary: 57% of homes secured a reduction at the ARC level, averaging 9.5% off their market value, about $111,021.
The nearly 225,000 residential properties that received a reduction with the ARC saved a combined $387.2 million in property taxes.
The middle of the market did worse. Homes between $500,000 and $750,000 won an average reduction of 7.4%, the lowest of any band in the county.
Town of North Hempstead homeowners did best, with average reductions of 11%. Long Beach posted a higher average, 11.5%, but a lower typical, or median, result—suggesting a small number of outsized reductions are lifting the average there.
1. The Participation Gap: Nassau’s $24.98 Billion Divide
In most of the country, appealing property taxes is rare. Nassau County's own review puts national appeal rates in large municipalities near 2.9%. However, in Nassau County, appealing your assessment is the standard. It’s part of the annual homeowner and financial checklist. Roughly 63% of residential properties filed a tax grievance in 2025.
The Cost of Missing Out
We cannot determine the potential savings for the 166,646 homes that received no reduction, as the roll does not track non-filers and some may already be assessed correctly. However, the roll reveals that 57% of homeowners who won tax grievances reduced their market value by an average of $111,021.
Nassau County 2025 Grievance Outcomes
Finding | Figure | Share / Context | Source Basis |
|---|---|---|---|
Residential Parcels Winning an ARC Reduction | 224,983 | 57% of county residential parcels | Observed, County Roll |
Residential Parcels With No Reduction (didn’t file or lost their grievance) | 166,646 | 43% of county residential parcels | Observed, County Roll |
Total Market Value Removed from Roll | $24.98 Billion | Total tax base reduction | Observed, County Roll |
Total Property Tax Savings | $387.2 Million | Class 1 residential properties | Derived, County & Internal Data |
Average Reduction Among Properties that Won One | $111,021 | 9.5% of market value | Observed, County Roll |
Estimated Participation Rate | ~63% | Derived from 57% at an assumed ~90% win rate | Derived, County Data |
How Much Are You Over Paying?
2. Where the Reductions Went
Local geography is one of the strongest predictors in the data. Market value reductions varied by city and town in Nassau County.
Average residential assessment reduction by city and town (2025)
Municipality | Properties that won a reduction | Share of county total that won | Average reduction | Median reduction | Average to median gap*
| Median dollar reduction |
|---|---|---|---|---|---|---|
Town of North Hempstead | 40,827 | 18.1% | 11.0% | 10.6% | 0.42 pts | $141,667 |
City of Glen Cove | 2,525 | 1.1% | 9.8% | 9.6% | 0.16 pts | $83,333 |
City of Long Beach | 5,353 | 2.4% | 11.5% | 9.1% | 2.42 pts | $73,334 |
Town of Oyster Bay | 59,348 | 26.4% | 9.2% | 8.8% | 0.33 pts | $86,667 |
Town of Hempstead | 116,930 | 52% | 9.1% | 8.6% | 0.50 pts | $76,667 |
County total or average | 224,983 | 100% | 9.5% |
|
| $86,667 |
*Gap computed from unrounded values; displayed figures are rounded.
There are four noteworthy takeaways:
1. Where your house sits changes the typical outcome by roughly two percentage points. The median reduction ran from 10.6% in the Town of North Hempstead down to 8.6% in the Town of Hempstead. On a house assessed at $900,000, that's about $18,000 in market value.
2. More than half of every successful residential grievance in Nassau, 116,930 of 224,983, was filed on a home in the Town of Hempstead, which reflects its size as the county's largest town. Reductions there averaged 9.1%, compared with 9.5% across the rest of the county. The roll doesn't tell us exactly why. Differences in housing mix are one likely factor. Since tax savings percentages vary significantly by home value, and different towns have different types of homes, these variations in the local housing stock naturally lead to different averages.
3. Averages and typical outcomes differ here, so the table reports both. Four of the five municipalities show a gap of 0.53 points or less between the two, except Long Beach, with a 2.4-point gap.
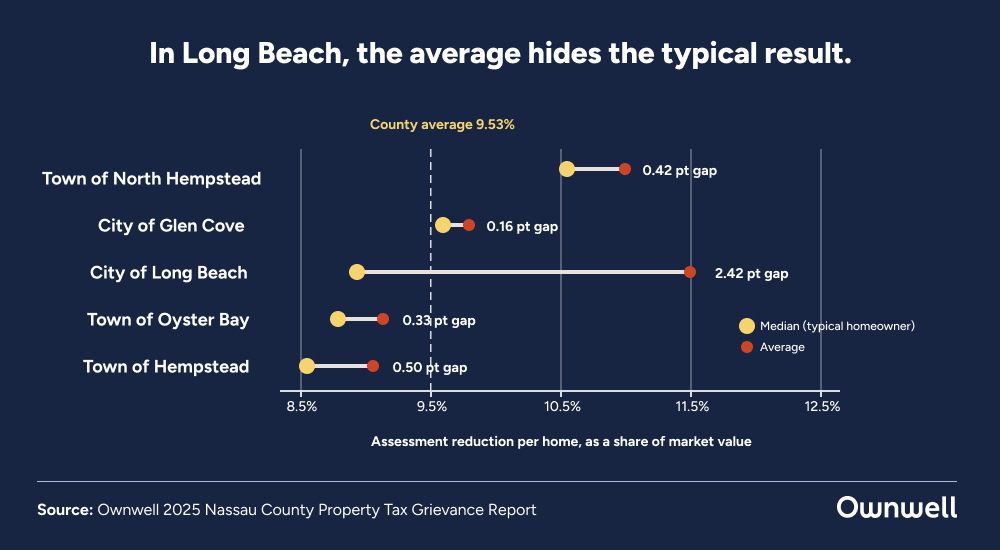
4. The typical Long Beach homeowner won less than the typical homeowner in North Hempstead or Glen Cove. Long Beach is the one municipality where the average and typical results differ drastically. Its average reduction, 11.5%, is the highest in the county, but its median is 9.1%, a 2.4-point gap that’s five times wider than any other municipality's. Across 5,353 parcels, a handful of very large reductions are doing that work.
3. Which Price Range Did Well?
Winning a tax reduction is great, but it only really helps if you’re getting the full amount you deserve.
By looking at these market value bands, we can see exactly where the biggest savings are happening and where others are falling short.
A few noteworthy takeaways:
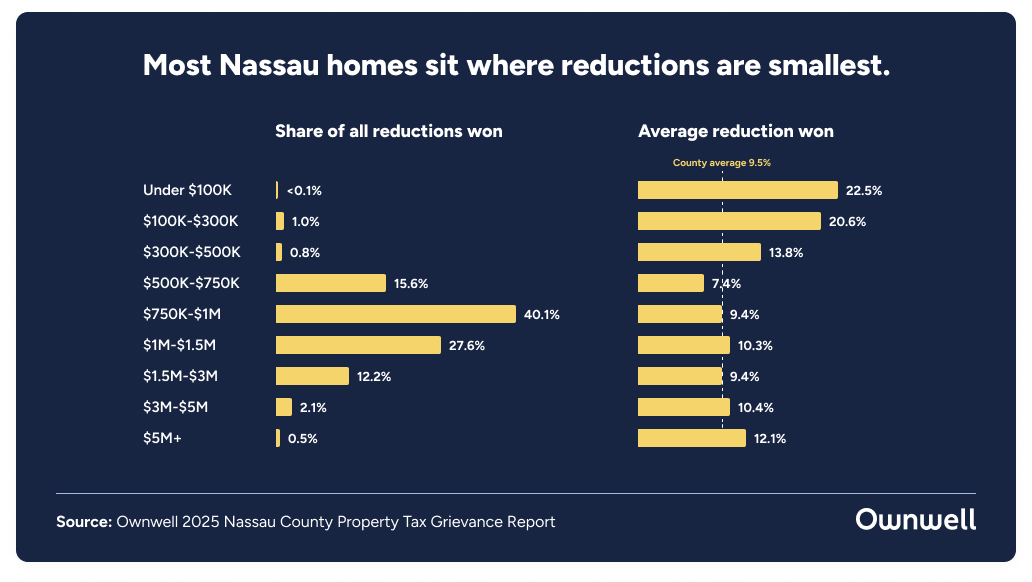
1. The 2,448 properties valued under $300,000 recorded reductions above 20%, more than double the county norm. Although these properties made up less than two percent of all reductions granted, their market value reductions were significant outliers.
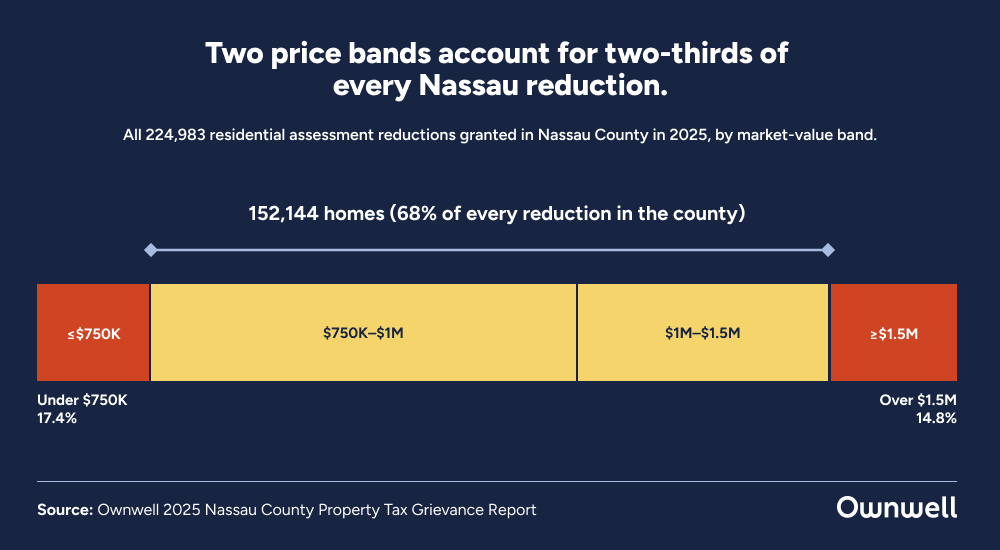
2. Properties valued between $750,000 and $1,500,000 represent 68% of all residential reductions granted in Nassau County.
3. The 35,124 properties valued between $500,000 and $750,000 received the lowest average reduction at 7.4%. Every other band above $300,000 landed between 9.4% and 12.1%.
This price range covers many Nassau starter or downsize homes, but they’re receiving the smallest reductions.
Full Market Value Band Breakdown
Market Value Band | Properties That Won a Reduction | Share of Winners | Average Reduction |
|---|---|---|---|
Under $100K | 97 | <0.1% | 22.5% |
$100K - $300K | 2,351 | 1.0% | 20.7% |
$300K - $500K | 1,893 | 0.8% | 13.8% |
$500K - $750K | 35,124 | 15.6% | 7.4% |
$750K - $1M | 90,145 | 40.1% | 9.4% |
$1M - $1.5M | 61,999 | 27.6% | 10.3% |
$1.5M - $3M | 27,515 | 12.2% | 9.4% |
$3M - $5M | 4,666 | 2.1% | 10.4% |
$5M+ | 1,193 | 0.5% | 12.1% |
All bands | Total: 224,983 | Percentage Total: 100% | Avg. Reduction: 9.5% |
Conclusion
The roll doesn't explain itself. It records what happened.
In 2025, 57% of Nassau homes saw their assessments lowered, and 43% did not. Among the homes that successfully lowered their market values, how much they won depended a great deal on where the house sits and what it's worth — from 7.4% in the $500,000 to $750,000 range to more than 20% at the bottom of the market, from 9.1% in the Town of Hempstead to 11.5% in Long Beach.
Some of that spread is the housing market. Some of it is who filed, and how well.
What the record shows plainly is that neither part is automatic. In Nassau, filing is ordinary. A good result still isn't.
Need Help Filing?
Nassau requires a new authorization form every year, so the 2028/29 filing window to sign a new agent or re-sign your current agent opened on September 6, 2026. Ensure you're getting the best service.
Last year, we averaged a 93% win rate and $1,462 in savings.
Want to Try What Made Ownwell Famous?
Methodology
Source: Nassau County Assessment Review Commission, 2025 residential assessment reduction roll. Data pulled and analyzed by Ownwell.
Scope: 391,629 residential marked properties. 224,983 recorded an assessment reduction at the ARC level.
Median Effective Tax Rate: We used an effective median tax rate of 1.55% based on internal Ownwell and Nassau ARC county data. It accounts for exemptions and is calculated based on Nassau County’s Residential Assessment Ratios (RARs) and adjusted assessed values. Please note that Nassau County’s Land Records Viewer does not always reflect this specific calculation.
What the roll captures: Reductions granted. It does not capture applications filed, applications denied, or whether a filer was self-represented. Every participation figure in this study is therefore derived and labeled as such.
Calculations: Reduction percentages are reductions in recorded market value. Municipality and band averages are count-weighted. Medians are not pooled across groups. We had one record labeled "Hempstead" rather than "Town of Hempstead.” We folded that into the Town of Hempstead.
Made assumptions:
90% win rate: The ~90% win rate used to derive the participation estimate is an estimate, not an observed figure from this roll. The national 2.9% benchmark comes from Nassau County ARC review, 2021.
63% participation rate: The county roll records reductions granted. It does not record applications filed, so participation was inferred rather than observed.
224,983 properties received a reduction, or 57% of the residential roll.
ARC data indicates that roughly 90% of filers obtain some reduction.
Working backward, 57% divided by 0.90 yields 63.33% participation.